


The Latest Northern Ireland Wedding Stats Fresh Off The Press!
Over the last few months we’ve been breaking down some of the latest marriage statistics to come out of Northern Ireland. And finally, we’ve put together our infographic depicting the patterns we’ve found. Take a peek below, and scroll further down to see some of our own speculation thrown in, along with comparison to the rest of the UK’s marriage trends…
Highlights of The Analysis
- Out of anywhere in the UK, religion plays a more important role in marriages in Northern Ireland
- Conflict is a catalyst for an increased number of marriages
- Fermanagh and Omagh is the most popular place to marry in Northern Ireland taking population of the county into account
- The 60s-70s were the most popular time to marry in Northern Ireland’s history.
Provisional Data
This infographic portrays data provided to The Wedding Secret by the NISRA from 2013 – at the time of publishing the data released is provisional, and is subject to change until the publication of the 2013 Annual Report of the Registrar General. Note also that 2013 is also the latest available statistical year – at the time of writing, 2014’s data has not been made available.
Further Reading: If you’re looking to get married in the UK, browse our selection of venues here
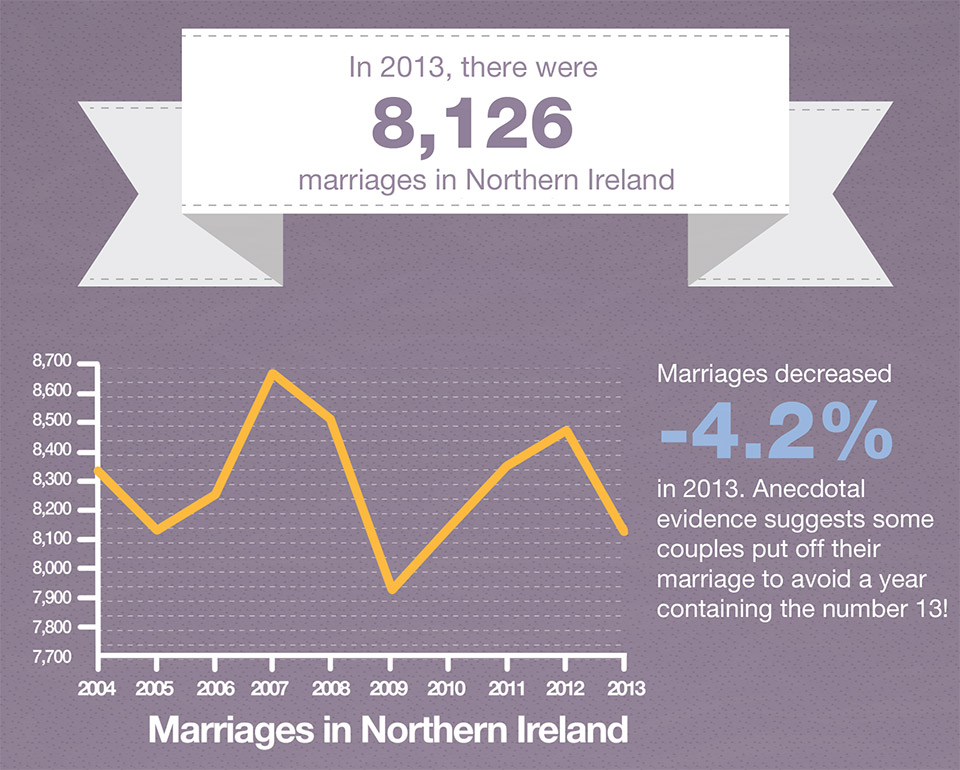
Number of Marriages
Northern Ireland celebrated 8,126 marriages in 2013. This is decrease in 4.2% compared to 2012. Some suggest that getting married in 2013 is unlucky – does this drop represent this notion? We can either look to the future, and wait for 2014’s data to be released, or look to the past for an insight to what this means…
The 100 Year Marriage Trend in Northern IrelandThe Wars
The Wars
This is an extremely turbulent era for Ireland as a whole – but very interesting from a statistical point of view. Still part of Great Britain, the whole of Ireland fought in WW1 (including what is now Northern Ireland). The data that we have in the graphic just takes data from the geographical area of Northern Ireland pre-independence in 1921.
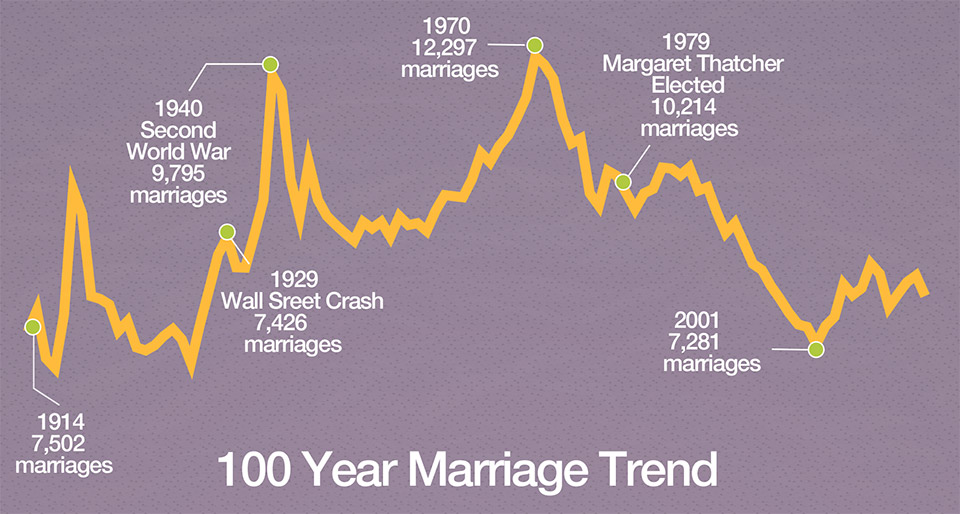
There’s a strong spike in the number of marriages just after the First World War. This is followed by a gradual decline in the number of marriages until a few years before WW2. Perhaps the conflict of the Irish War of Independence and Irish Civil War are to blame here.
The story of marriages and WW2 is similar to the rest of the UK. Two peaks pre and post war.
The 70s
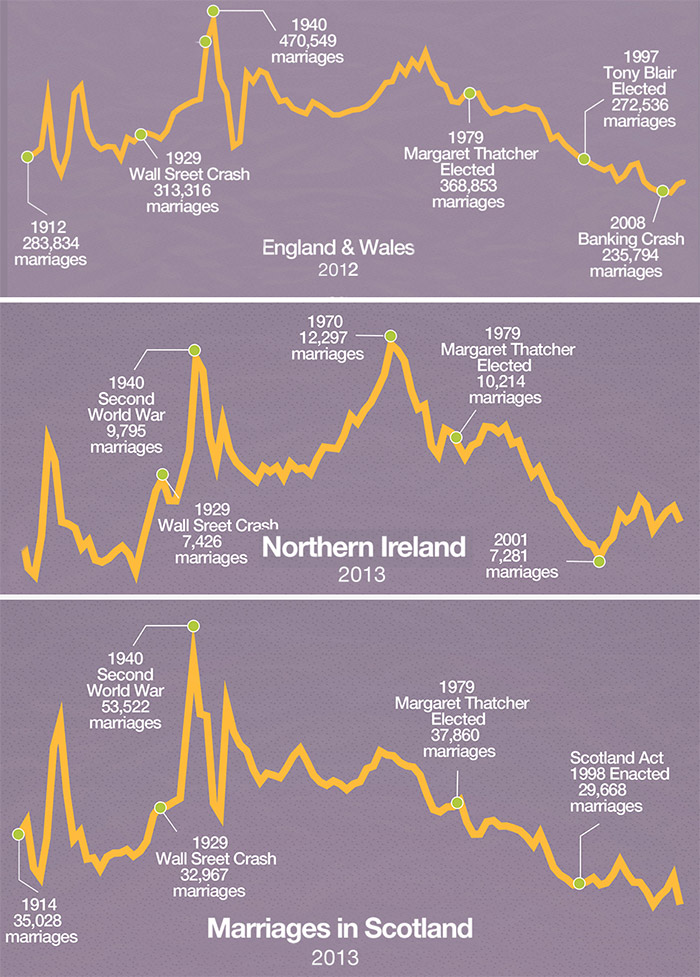
1970 sees the largest number of marriages in Northern Ireland’s history – 12,297, beating even the pre/post-war figures. This follows on from a general upward trend after the end of the second war. This stands out as unique from the marriage statistics we have seen from all the other countries in the UK, where in England and Wales we see a general decline followed by a consistent boost in the 60s-70s. In fact, this 60s-70s boost isn’t even visible in our Scotland Infographic.
In our England and Wales infographic, we speculated that this sustained peak in marriages was due to the Baby Boomers reaching the average marrying age. But does that tell all of the story for Northern Ireland?
The Troubles
We can’t help but mention the well-known period of strife called The Troubles (Northern Ireland Conflict), which began in the late 60s and only ended in 1998 with the Belfast ‘Good Friday’ Agreement. Did The Troubles have influence on this peak of marriages in 1970s? Conflict brought about by the world wars certainly led to an increase in marriages, so the same could be true here.
The last 15 years
After a gradual downward trend from the 80s onward, marriages were suddenly on the increase in 2001.
Did the signing of the Belfast ‘Good Friday’ (1998) agreement spell a period of stability?
Or is it The Marriage (Northern Ireland) Order 2003 – where civil ceremonies were allowed in approved premises, which had something to do with this increase?
This upward trend is unique to Northern Ireland, with both Scotland and England and Wales’ pattern of marriages continuing the downward trend from the 70s.
Where?
This data has been organised to reflect the Local Government Reform, reducing the 26 counties to 11, due to take over on 1 April 2015. The data from the separate counties of 2013 have already officially been combined by the NISRA.
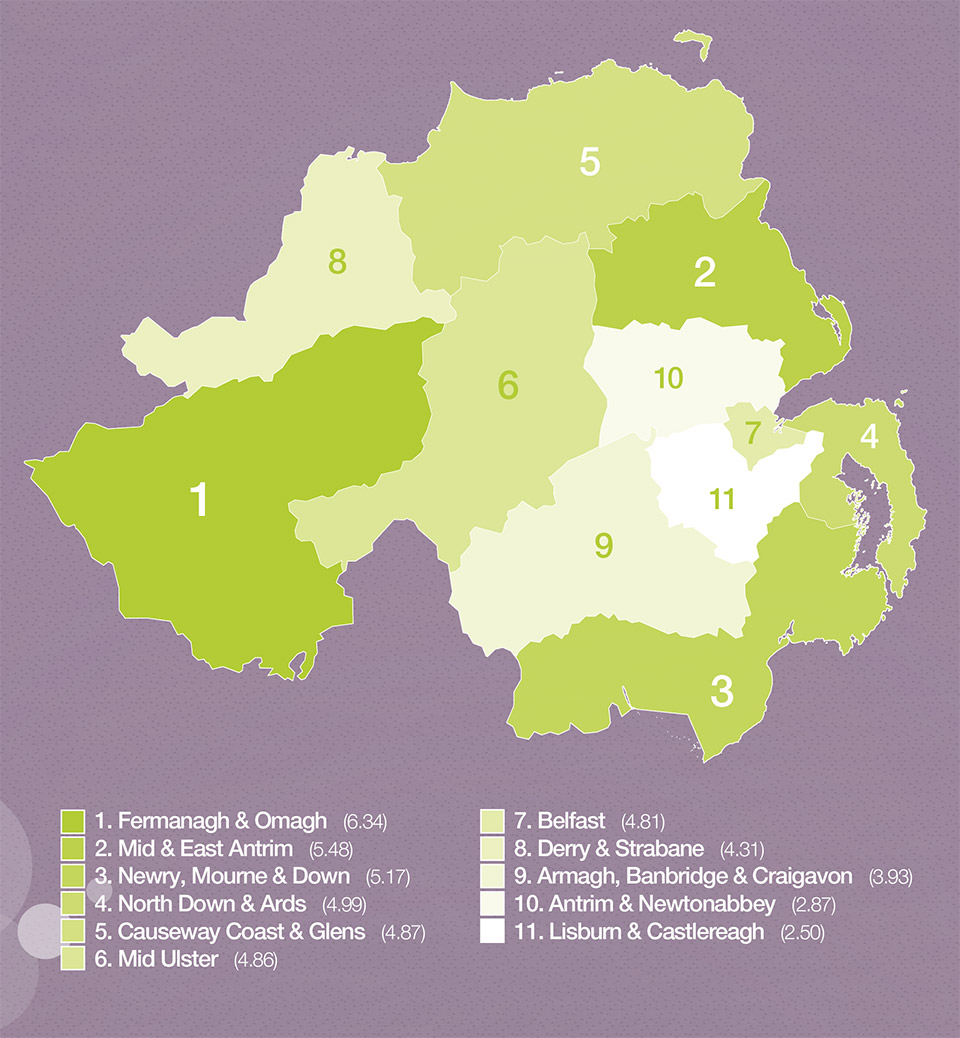
Fermanagh and Omagh
In terms of number of marriages related to the population of the county, Fermanagh and Omagh is the most popular, with 6.34 marriages for every 1000 people living there. There are plenty of possible reasons why this could be…
- It’s the largest of the new counties (one eighth of Northern Ireland’s land mass), with significant amounts of the area being covered by water like Upper and Lower Lough Erne, and rural areas such as peatlands and mountains. Thanks to this it has a relatively low population.
- The county is known for its beautiful countryside and stunning vistas, and has a strong tourism trade. Areas like Lough Erne which are likely to contribute to the high marriage numbers per capita population in Fermanagh and Omagh. It’s a popular destination for couples travelling from outside the county, and perhaps even the country!
Mid and East Antrim
In 2nd place it’s Mid and East Antrim (previously Boroughs of Ballymena, Larne and Carrickfergus), which includes parts of the stunning Antrim Coast and the Glens – another popular destination, this time in close proximity to Belfast.
Least Popular Regions
The least popular regions are Lisburn & Castlereagh and Antrim & Newtonabbey – interestingly these are the least popular regardless of population too (ignoring the number of marriages per 1000 people method). This suggests that couples in Northern Ireland prefer to get married away from urban/suburban areas such as those around Belfast.
Northern Ireland’s Popularity For Marriages in The UK
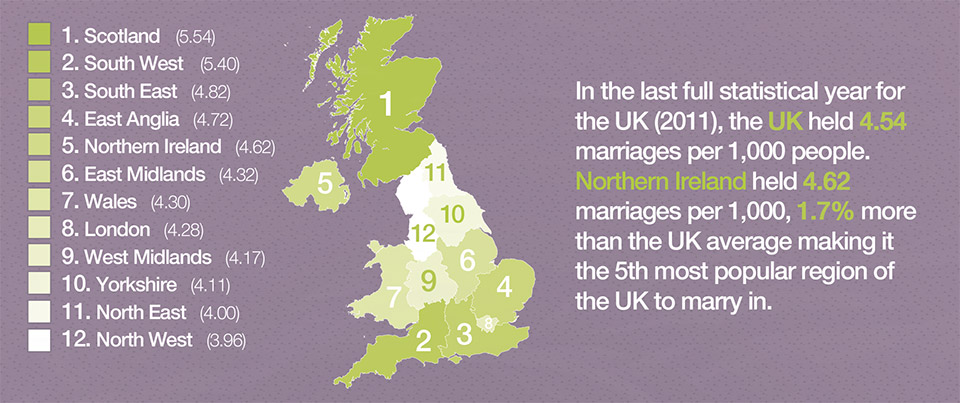
So how does Northern Ireland stack up against the rest of the UK in terms of its marriages in 2013? With the UK holding 4.45 marriages for every 1000 people, and Northern Ireland holding 4.62, the country is more popular than average, and in the top 5 most popular countries and regions in the UK.
When?
Time of the Year
This is data for 2013. It comes as no surprise that the summer months are the most popular, and the winter least popular.
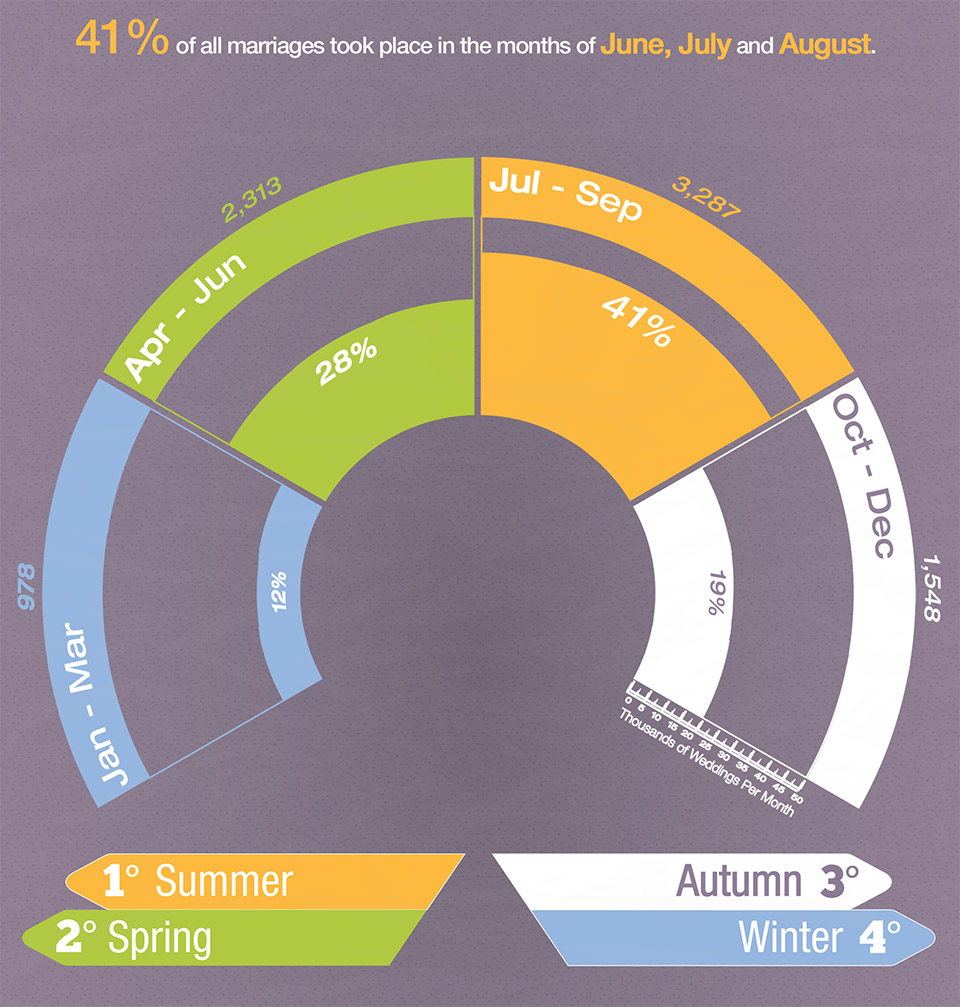
These figures closely match what we see for England and Wales, Scotland and the UK as a whole.
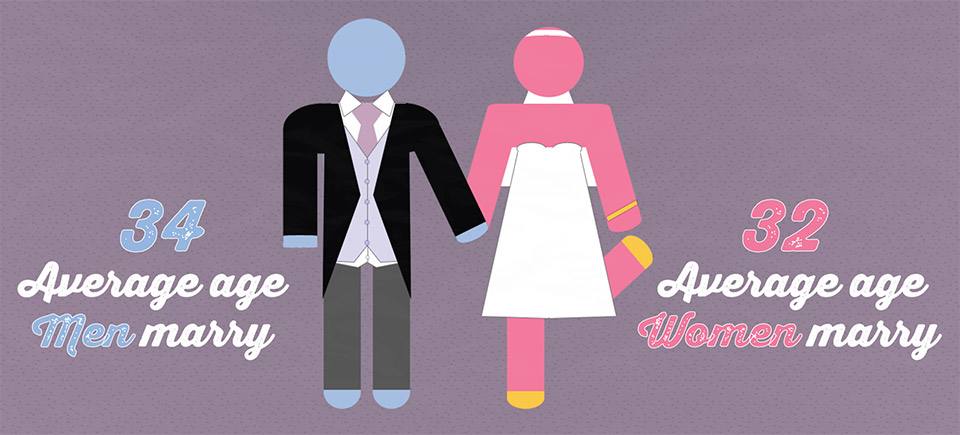
Age
The average age for marrying brides in Northern Ireland in 2013 was 32 and 34 for grooms. Note that this takes second (divorced or widowed) marriages into account. The average age for first marriages was 30 for brides and 32 for grooms.
Adding some new data to the mix, County Derry holds marriages with the oldest couples on average, with the age for husbands being 34.1, and brides 31.9.
The youngest is Graigavon with husbands being 32.1 and brides 30.4
Type
The first thing to note here, especially in comparison to the rest of the UK, is that religious ceremonies were the dominant type which took place in Northern Ireland in 2013 (69%).
This hints towards Northern Ireland being made up of a more conservative, traditional and less secular population.
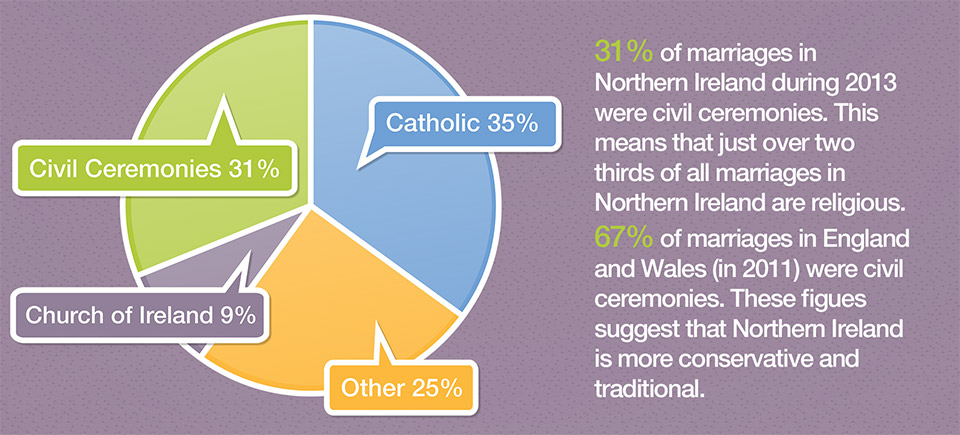
Other
You can see that a quarter of marriages that took place were classed as ‘other’. It’s important that we clarify this before going any further.
This amount includes other faiths, primarily other protestant denominations like Presbyterian (12%) and Methodists (9%).
Catholic Marriages
Just over half of all religious marriages that took place in Northern Ireland in 2013 were Catholic. This reflects the religious story of Northern Ireland.
As part of the official 2011 census (NISRA), 40.8% of residents stated they were Catholic, with 35.8% of the population stating they are of the Protestant faith (combined Anglican, Presbyterianism, Methodist).
With 35% of all marriages being Catholic, and (at least) 30% being Protestant, these figures show that marriages truly do have a significant social story to tell!
Conclusions
Once again, rural and picturesque regions such as Fermanagh and Omagh have quite the pull when it comes to hosting marriages.
Marriage type and occurrence within a given country are an extremely useful insight into its socio-economic history – especially so with Northern Ireland. The 60s-70s show the most popular period in Northern Ireland’s marriage history, unlike England and Wales, where the war-period was the most popular.
Northern Ireland has the highest percentage of religious marriages in the whole of the UK, the majority of which were Catholic – again making Northern Ireland stand out from the crowd.
Please Share!
If you liked some of the statistics and information that we’ve shared with you, then please help spread the word. You can view the original infographic here, or click one of the social media icons


